Live Travel and Weather Updates using APIs
Summary. Having up to date and specific weather and travel information in a single point of reference for the daily commute can be a very useful time saver and convenience. This project uses real time and forcasted data from the Transport for London Unified API and the MET Office weather API Datapoint to develop a plotly Dash dashboard. The dashboard provides up to date travel information for several designated routes as well as real time and forcasted weather information for the local area. The dashboard is deployed online using Heroku.
Skills Used:
- Programming (Python: Ploty Dash).
- Deployment (Heroku).
Introduction
The steps followed in order to create a weather and travel app that would be useful for the end user were:
- Define what information would be most useful to the user.
- Identify from searching the available API data, which parts of that data most closely matched the requirements from 1.
- Work out how to retrieve the information required from the relevant APIs.
- Design a ploty Dash dashboard to display the information retrieved in a clear/ appealing way.
- Deploy the app using Heroku.
User requirements for the data
The anticipated end user for this app works outside for a significant proportion of their typical day. They also use public transport to get to and from their place of work, which requires some time being spent walking between transport terminals. These requirements meant that it is important that the weather information not only provides real time data, but short period forcasted data up to a few days but certainly over the current working day. The end user has several different options in terms of getting to their place of work. Information from each of these needs to be incorporated into the dashboard, most ideally approximate next arrival times, statuses of each route and reasons for any delays.Identifying and Extracting relevant information from the APIs
Weather Information
The MET Offices Datapoint service [1] provides a wealth of real time and forcasted weather related information, available free of charge to those who sign up for a user account. Using the description of data available from their website the three hourly site specific forcast data was deemed most useful to the end user. Querying the following url with the requests package in Pythonhttp://datapoint.metoffice.gov.uk/public/data/val/wxfcs/all/json/sitelist?res=3hourly&key=API_Key
allowed the location ID, a number for the site of interest to be found. The three-hourly forcast for the site of interest was then found by querying
http://datapoint.metoffice.gov.uk/public/data/val/wxfcs/all/json/SITE_ID?res=3hourly&key=API_KEY
which returns a json file which was decoded into a dictionary. The json_normalize package was then used for flattening the json into a pandas dataframe, in particular on the following part of the dictionary
json_normalize(json_data['SiteRep']['DV']['Location']['Period'][0]['Rep'])
This yielded the weather forcast for the first period in the data retrieved, the appearance of which is shown in Figure 1.
Figure 1: Format of data displayed for first period.
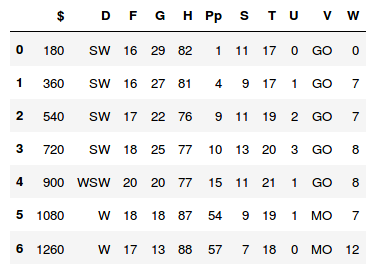
The columns show the forcast data in terms of different variables with the rows representing different times in the current three hour period. In order to decode the column variables used, the contents of
json_normalize(json_data['SiteRep']['Wx']['Param'])
was used which is shown in Figure 2.
Figure 2: Column names and their meanings.
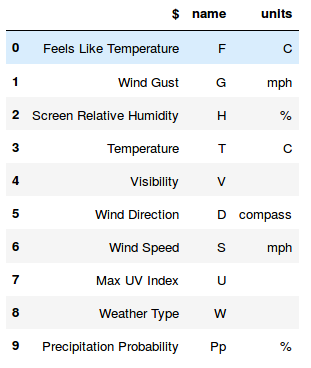
The units were added to the variable description and then the column names from the dataframe shown previously renamed accordingly with
.rename(columns=weatherheader.set_index('name')['$'], inplace=True)
Weather codes stored as a dict allowed codes in the 'Weather Type' variable in the dataframe to be translated to meaningful string representations.
Transport Information
Transport for London's Unified API [2] was used to retrieve transport data. From the list of available requests on their website, the 'Gets the list of arrival predictions for the given stop point id' query seemed the most useful for the end user. However, this required the 'naptan ID' codes for each stop point of interest as input. These were found using the following steps:
- Googling the bus stop to find the 5 digit bus stop id.
- Using the query 'Search StopPoints by their common name, or their 5-digit Countdown Bus Stop Code' to get the stopping ID.
- Using the query 'Gets a list of StopPoints corresponding to the given list of stop ids' to get stop point naptan IDs.
https://api.tfl.gov.uk/StopPoint/StationNaptanCode/Arrivals?mode=bus&line=BUSNUMBERapp_id=USERID&app_key=USERAPPKEY
which allow data in the json format to be accessed. A similar procedure was followed to retrieve the relevant tube data.
The data from these requests was investigated in more detail to find out its structure and identify how to extract the elements of interest. The json output was decoded into a dictionary and then turned into a dataframe with json_normalise. The result was a dataframe with variables listed in columns and rows representing the different bus numbers and their relative direction (inbound or outbound with respect to central london). In order to identify the buses and directions of travel of interest, the dataframe was filtered based on lineID (bus number) and destination (indicating direction of travel). A loop through the remaining data points allowed each of the subsequent arrival times to be found. For the tube data, a general status of the line of interest was identified using
json_result[0]['lineStatuses'][0]['statusSeverityDescription'] # status as string description
json_result[0]['lineStatuses'][0]['reason'] #reason
Presenting the information in a Dashboard with Plotly Dash
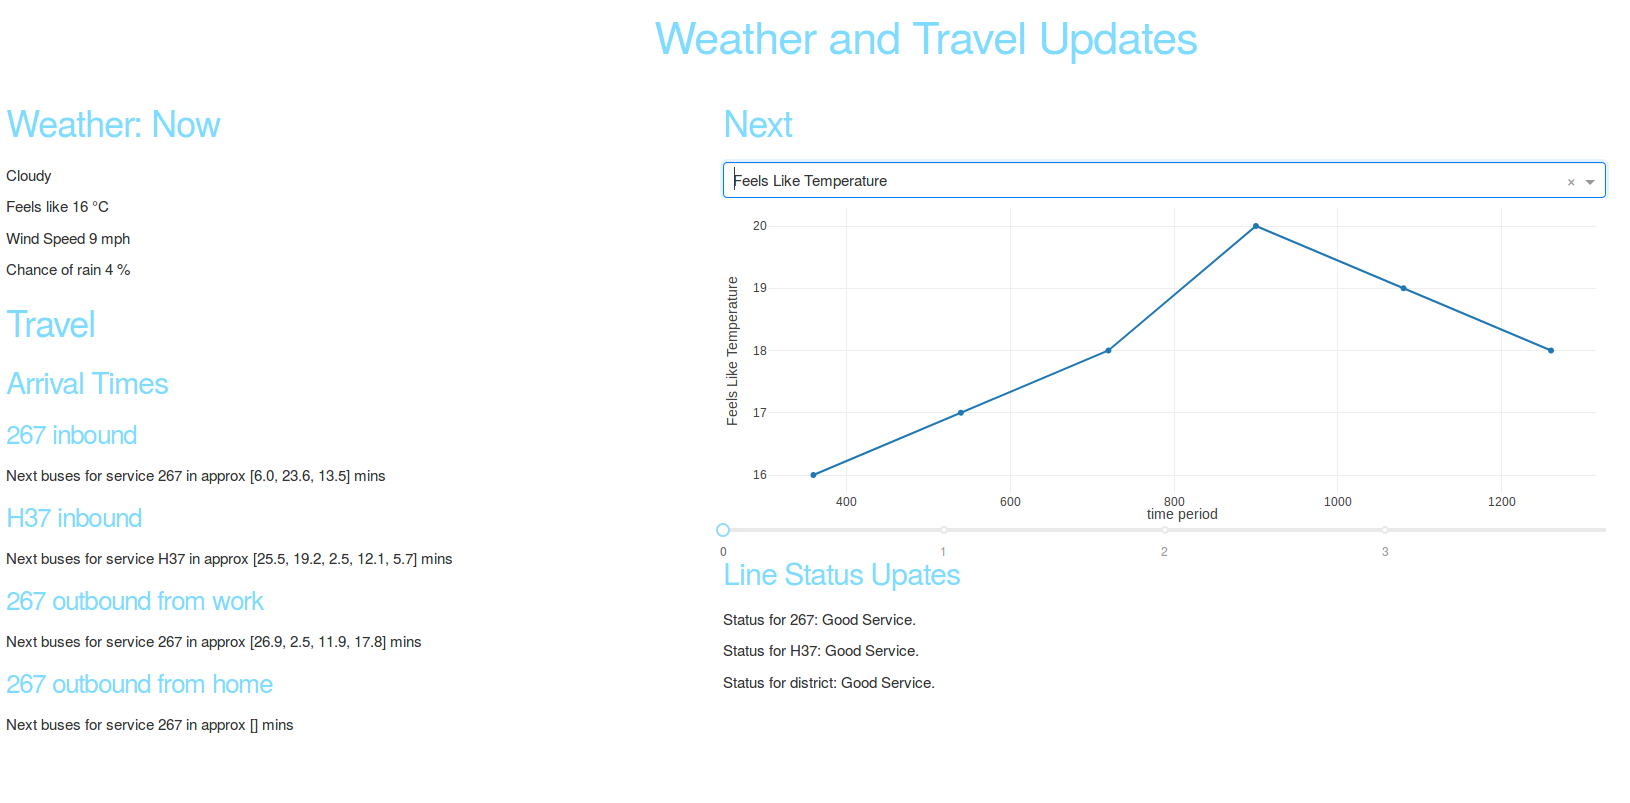
Plotly Dash [3] seemed an attractive proposition to use to create the dashboard for this project. It's key advantage is that all the dashboard can be written in Python. Having retrieved the data and extracted the relevant information, the main task was to define the layout in app.layout. Much of the data is currently presented in text form as this seemed most sensible in order to get things up and running and considering for the end user interactivity is unlikely to be important. However, some of Dash's interactive capabilities were investigated by presenting the numeric weather information in a line graph with the variable of interest selectable from a drop down menu and shown on the y axis with time/ subsequent forcast periods on the x axis. A slider was added to enable the user to move through subsequent three hour forcast windows. The current format of the dashboard is shown in Figure 3. The dashboard was set up to refresh the information displayed on page reload.
Figure 3: Dashboard layout.
Deploying with Heroku
Heroku [4] was used deploy the app on the web. This required a free Heroku account and Python 3.6, pipenv and Postgres be installed locally. The Heroku command line interface was installed on linux using
sudo snap install heroku --classic
Then using
heroku login
requests the login details. The app was deployed to Heroku using
heroku create
git push heroku master
Different numbers of instances of the app can then be run using
heroku ps:scale web=number_of_instances
Heroku recognises it is dealing with a Python app by the existence of a requirements.txt file. Requirements for the app are dealt with using pipenv. For debugging and development a local version of the app can be run using
heroku local web
which uses the local Procfile to find what to run. The app is available at http://localhost:5000. To push changes to Heroku the following is used
git add .
git commit -m "Demo"
git push heroku master
Bibliography
- M. Office. MET Office Datapoint (Contains public sector information licensed under the Open Government Licence), MET Office, 2018.
- TfL. Transport for London Unified API Powered by TfL Open Data (Contains OS data © Crown copyright and database rights 2016), Tfl, 2018.
- P. Technologies. Collaborative data science, Plotly Technologies Inc., 2015.
- Heroku. Cloud Application Platform, Heroku Inc., 2007.